Out-of-the-box
Solution
Intra-day and T+1 monitoring of transactions flow with immediate and worked orders support, advanced visualizations, alerting, filtering, and outlier management, aggregate reporting, and compliance workflow.
Built on OneTick, the world’s most advanced tick data management and streaming analytics platform
OneTick Best Ex & TCA is built on OneTick, the world’s most advanced tick data management and streaming analytics platform. This powerful foundation enables you to:
Cut Regulatory Risk: Meet stringent regulatory requirements from bodies like US SEC/FINRA, CFTC/NFA, Europe’s MiFID II/ESMA, and Canada’s IIROC/UMIR rules with pre-tuned solutions. The system stores "every reportable event," including all stages of an order's life cycle, crucial for MiFID II compliance.
Gain a Competitive Edge: Optimize venue selection and perform in-depth Transaction Cost Analysis (TCA).
Enhance Operational Efficiency: Benefit from intra-day and T+1 monitoring of transaction flows, advanced visualizations, and an auditable compliance workflow.
Our solution delivers comprehensive capabilities for both immediate ('held') and algorithmically-worked ('not held') orders, providing deep insights into execution performance.
Comprehensive Order Lifecycle Analysis: The system's transactions data storage model captures the entire lifecycle of each order, including parent-child relationships and interactions with trading venues, supporting both Best Execution and Market Surveillance monitoring.
Detailed Execution Quality Metrics: OneTick Best Ex & TCA provides a wide array of metrics to assess execution quality, categorized by order type: Small Orders (often benchmarked to market at order orrival) and Large Orders (executed algorithmically/manually over time with interval benchmarks).
Flexible Customization and Extensibility: OneTick Best Ex supports end-user creation of additional metrics and statistics directly within the dashboard using a configurable window with limited scripting. This allows for the development of complex formulas, such as custom venue ranking.
Best Execution Alerting: The system includes an out-of-the-box alert type specifically for Best Execution, which is triggered when an execution price is significantly worse than the prevailing market price, or when an order, typically a client’s Stop Loss or Take Profit order, is executed away from its limit rate. This helps identify cases where aggressive orders might have outsized available liquidity or were mispriced.
OneTick Best Ex & TCA is available through multiple deployment models to suit your operational needs:
Hosted Implementation (SaaS/PaaS): A convenient service combining our Cloud market and reference data content with 24x7 managed services. It leverages the data management performance and analytics power of the OneTick Streaming Analytics engine, including advanced visualizations, Best Ex alerting, and compliance workflow.
Deployed (On-Premises): Supports closer integration with your existing infrastructure and proprietary data sources. This option allows for intra-day monitoring and integration of your customer-developed metrics.
The sky's the limit with the OneTick solution. Cue comprehensive, powerful analytics:
SC(A)IL (Smart Compliance Insights Lab): For deeper ad-hoc analysis, OneTick Best Ex data is accessible via SC(A)IL, our SaaS environment based on JupyterLab. Here, you can create custom Best Execution reports with full access to our TCA library, ask questions using SQL or Python/Pandas, and even leverage AI for query assistance.
Case Management System (CMS): Alerts generated by OneTick Best Ex are automatically swept into the CMS, supporting comprehensive workflow management, auditing, and reporting for compliance teams.
Choose OneTick Best Ex & TCA to precisely monitor, analyze, and optimize your trading execution, ensuring both regulatory adherence and superior performance.
Intra-day and T+1 monitoring of transactions flow with immediate and worked orders support, advanced visualizations, alerting, filtering, and outlier management, aggregate reporting, and compliance workflow.
Meet your monitoring and reporting obligations at a cost far below in house development and competitive products.
Tuned for regulatory regimes: US SEC/FINRA and CFTC/NFA, Europe’s MiFID II/ESMA, Canada’s IIROC/UMIR rules
When deployed on-premises, OneTIck BestEx supports closer integration with customer infrastructure and proprietary data sources, supports intra-day monitoring, and allows integration of customer-developed metrics.
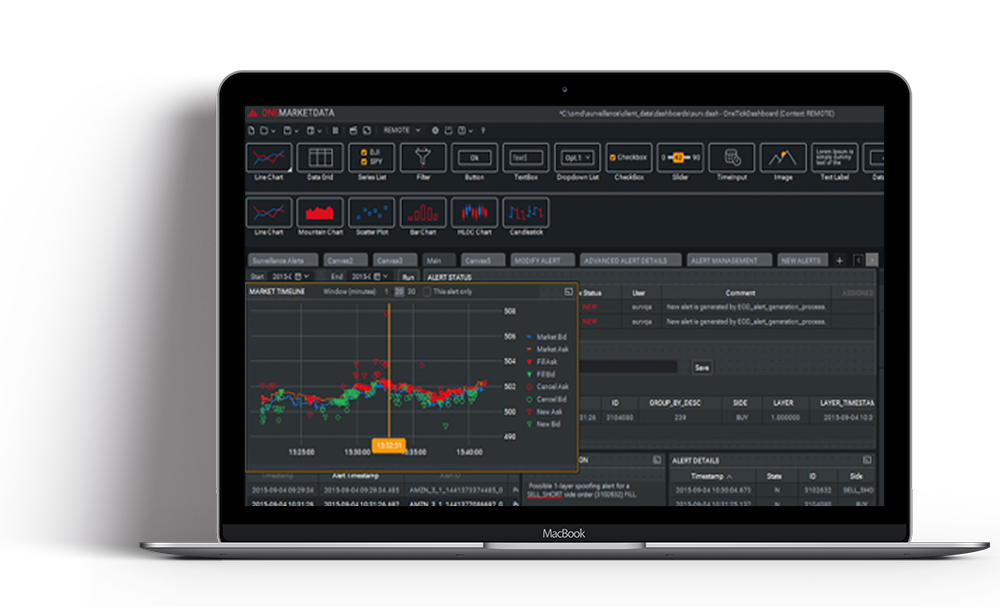
OneTick BestEx supports end-user creation of additional metrics and statistics by means of a configurable window that allows limited scripting right in the Best Ex dashboard.
Metrics may be created that are simple or complex functions of any other data columns present in the enriched data. Complex filters may also be created using the code widget. For example, it might be used to create a venue ranking formula that is based on a combination of venue-relevant execution quality metrics and market statistics.
They may be client orders marked as ‘held’ or DMA orders or SOR orders at the parent or child level. They may be aggressive or passive. Some metrics are more appropriate for marketable orders (e.g. ETQ), and others more appropriate to passive orders (e.g. opportunity cost). The following table lists a subset of the supported metrics.
Measures the notional distance the impacted side moved from the best price when the order arrived. May be calculated relative to a windowed spread that accommodates small timestamp misalignments or quote flicker.
Quantifies the impact of an aggressive order by measuring how much the midpoint of the spread moved from the price prevailing at order arrival. Defined in U.S. Reg. NMS Rule 605 and ESMA RTS 27 Article 2(l)
The ratio of Effective Spread to Quoted Spread, expressed as a percentage.
The ratio of the executed size to the available top-of-book liquidity at arrival.
The ratio of fill quantity to expected quantity.
For aggressive orders, a version of Fill to BBO size ratio that yields p(success) when aggregated.
A five minute forward mark-out, as defined by U.S. Reg. NMS Rule 605.
Backward and forward mark-outs from the arrival mid-point to the backward or forward mid-point at a configurable set of time horizons.
Median, Mean, and Max execution delays. For single orders, the delay to first and last execution are calculated. In reports, may be calculated selectively for aggressive orders.
Calculate the notional cost of non-execution for non-executed orders, similar to large order opportunity cost.
Includes volume, notional value, and percentages of orders executed outside, at, and inside the NBBO.
When received from a customer, they would typically be marked ‘not held.’ Large orders may have child orders for which ‘small order’ execution quality metrics are useful. For large orders, the primary metrics of interest are achieved price vs. a benchmark and opportunity cost (hypothetical achieved price vs. a benchmark for the non-executed portion).
The variety is in the benchmarks.
Compares the order's VWAP against the market’s arrival or decision price.
Measures the order’s achieved VWAP against the market’s interval VWAP.
Measures the order’s achieved VWAP against the market’s interval TWAP.
Compares the order’s VWAP against the market's opening price.
Compares the order’s VWAP against the market's final fill price (or mid-quote).
Calculate the cost of the un-executed portion of an order, marked from a hypothetical execution price (e.g. the VWAP) to any of the benchmark prices listed above.
Similar benchmarks to those listed above, but filtered to remove outlier prices.
E.g. all day VWAP, previous day(s) average price.
Benchmark the order to the market’s VWAP, assuming a fixed participation rate. Benchmark participation rates are configurable.
Compare the order's VWAP against configurable forward and backward ‘marks’, including the Close, the previous day Close, and multi-day horizon forward and backward closing prices.
The order’s calculated participation rate.
Calculate the maximum interval participation rate.
Compare to all-day volatility. Longer term benchmarks available with OQD data.
Indicates the aggressiveness of an order, based on venue-provided liquidity flags or limit price heuristics.
Includes volume, notional value, and percentage of orders executed outside, at, and inside the NBBO.